.Optional caption (1)
[source,language]  (2) (3)
----
Source code  (4)
----
Using AsciiDoc in Maven Site
AsciiDoc became de-facto standard documentation language for OpenDaylight,
so if you are using odlparent-lite, odlparent or any parent POM derived from
these, ODLParent-based Maven Site support AsciiDoc with additional
following features:
Overview
AsciiDoc belongs to the family of lightweight markup languages, the most renowned of which is Markdown.
AsciiDoc stands out from this group because it supports all the structural elements necessary for drafting articles, technical manuals, books, presentations and prose. In fact, it’s capable of meeting even the most advanced publishing requirements and technical semantics.
Asciidoctor.org ,which we are using, provides excellent guide how to write in AsciiDoc.
Code Highlighting
Asciidoctor.org integration provides support for code examples and highlighting syntax in code blocks.
Anatomy of a source code block
| 1 | Optional caption of code listing |
| 2 | source keyword is required to mark block as source code listing |
| 3 | Optional specifier of language |
| 4 | Actual source code. |
Support of code highlighting depends on used highlighter backend, but most
common languages are usually supported. Usually following language identifiers
are supported :
java, scala, groovy, c, ruby, html, xml, json, javascript,
yang (not all highlighters support it).
See Asciidoc Writer’s Guide for more examples and additional documentation on source code.
Diagram Rendering
Diagrams are vital part of software documentation, but it is hard to standardize on format and standard image formats are cumbersome to maintain and track in changing environment of software development. Textual form of diagrams in AsciiDoc makes easier to separate layout and rendering from content and it is more natural to be version tracked.
Diagram rendering is provided by asciidoctor-diagram extension to Asciidoctor,
which allows you to inline / create diagrams in text and the extension takes
care of rendering them into images.
Most usable family of diagrams is probably plantuml family of diagrams, which
allows you textually specify UML models and extension takes care of rendering
images.
Although asciidoctor-diagram provides various types of diagram and
backends, it is necessary to have these backends installed in order for them
to work. If backend is not present, asciidoctor-diagram will display source
of diagram instead.
|
Creating diagram
A diagram is written inside a literal block, which can accept several attributes.
Anatomy of a diagram
[block-name, generated-file-name, generated-file-extension]   (1) (2) (3)
.... (4)
ditaa, PlantUML or other supported diagram syntax
....| 1 | The first position in the attribute list assigns the block’s name. |
| 2 | The second, optional position assigns a file name (i.e. target) to the generated diagram. If a target is not specified an auto-generated name will be used. |
| 3 | The third, optional position assigns a file extension (i.e. format) to the generated diagram. |
| 4 | Place the attribute list directly on top of the delimited literal block (….). Diagram block names can also be assigned to open blocks (--). |
The following block names and output formats are available:
plantuml-
Supports
png,svgandtxtoutput formats. graphviz-
Supports
pngandsvgoutput formats. ditaa-
Supports the
pngoutput format.
PlantUML diagrams
In order to use and render PlantUML diagrams you need
Graphviz installed and be familiar with PlantUML syntax.
Inside Asciidoc block you should not use @startuml and @enduml tags.
Source
.Example Diagram (1)
[plantuml, odlparent-overview, png]   (2) (3) (4)
....
component "odlparent-lite" as odlparent.lite (5)
component "odlparent" as odlparent
odlparent -> odlparent.lite
....| 1 | Title of diagram |
| 2 | Type of diagram, in this case it is PlantUML diagram |
| 3 | Name of generated file, in this case it is odlparent-lite |
| 4 | Type of generated file |
| 5 | PlantUML source of diagram. |
This Asciidoc source would result in following:
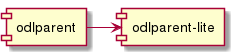
Figure 1. Example Diagram
Types of Diagrams
PlantUML provides support for following types of diagram:
Component diagram
Example source
.Example component diagram
[plantuml, component-overview, png]
....
() HTTP (1)
() "Servlet API" as servlet.api (2)

component "HTTP Server" as server (3)
component "HTTP Client" as client
component "Java Application" as app


client ..> HTTP : use (4)
HTTP - server (5)
server - servlet.api

app ..> servlet.api : use
....| 1 | Definition of interface HTTP |
| 2 | Definition of interface Servlet API with alias servlet.api |
| 3 | Definition of component HTTP Server with alias server |
| 4 | Definition of uses relationship : dashed link between client and HTTP with use label |
| 5 | HTTP Server provides HTTP API.
This source would result into following diagram: |
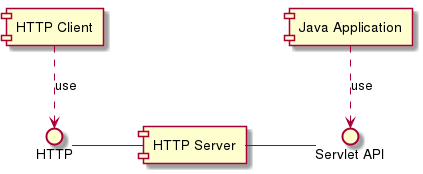
Figure 2. Example component diagram
For more documentation and examples of component diagrams see PlantUML documentation on Component Diagram.
Class diagram
Example source
.Class Diagram
[plantuml,abstract-list-example, png]
....

class Object { (1)
  + toString() : String
}
interface Iterable<T> { (2)
  + hasNext() : boolean
  + next() : T
}

Object <|-- AbstractList<T> (3)
Iterable <|.. AbstractList<T> (4)
....| 1 | Explicit definition of class Object |
| 2 | Explicit definition of generic interface Iterable |
| 3 | Implicit definition of class AbstractList, which extends Object |
| 4 | AbstractList implements Iterable |
The source will result into following diagram:
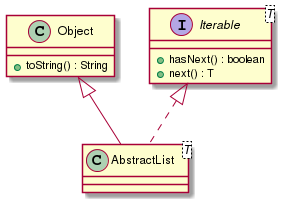
Figure 3. Class Diagram
For more documentation and examples of class diagrams see documentation of Component Diagram.
Sequence diagram
Example source
[plantuml, sequence-example, png]
....
Alice -> Bob: Authentication Request
Bob --> Alice: Authentication Response

Alice -> Bob: Another authentication Request
Alice <-- Bob: another authentication Response
....
The source will result into following diagram:
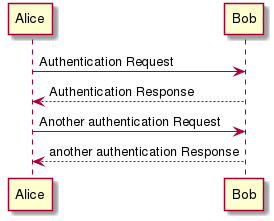
Figure 4. Sequence diagram example
For more documentation and examples of sequence diagrams see documentation of Sequence Diagram.
Activity diagram
For more documentation and examples of activity diagrams see documentation of Activity Diagram or different syntax for Activity Diagram.
State diagram
For more documentation and examples of state diagrams see documentation of State Diagram.