The Topology tab displays a graphical representation of network topology created.
![[Note]](../common/images/admon/note.png) | Note |
|---|---|
DLUX UI does not provide ability to add topology information. The Topology should be created using an open flow plugin. Controller stores this information in the database and displays on the DLUX page, when the you connect to the controller using openflow. |
To view network topology:
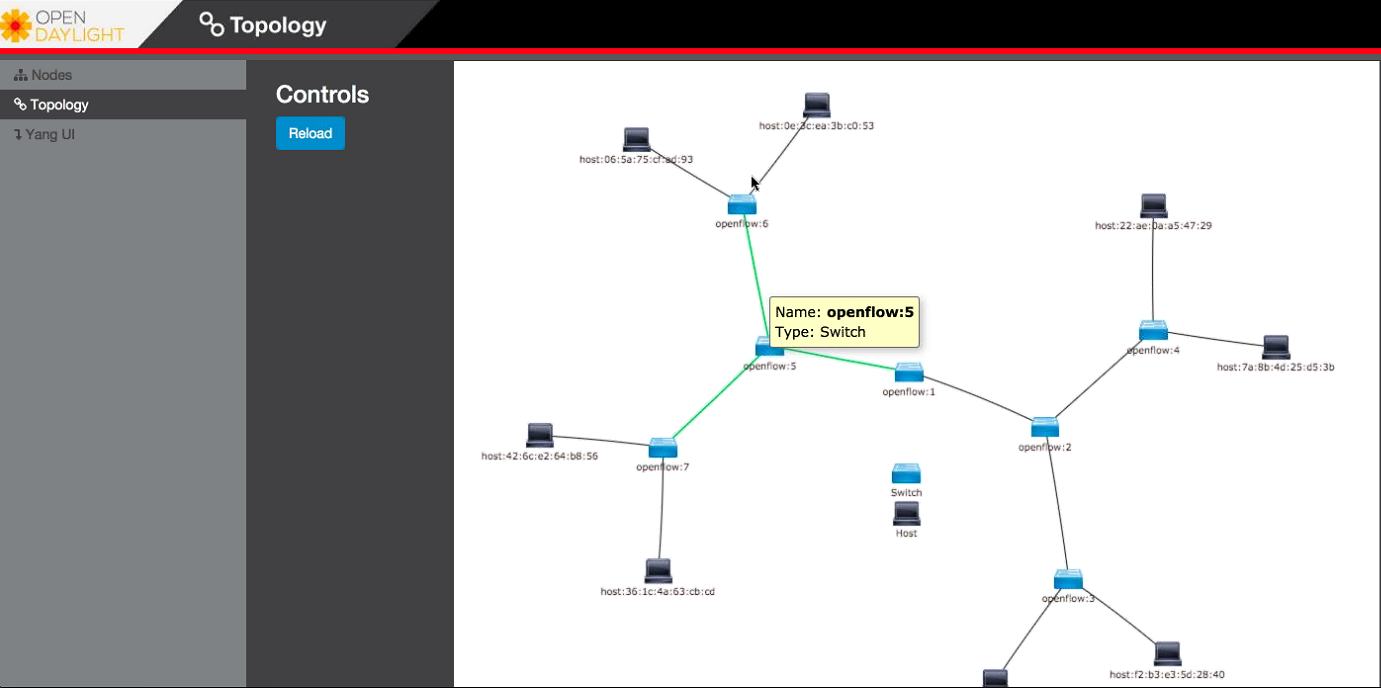
- Select Topology on the left pane. You will view the graphical representation on the right pane. In the diagram blue boxes represent the switches, the black represents the hosts available, and lines represents how switches are connected.
- Hover your mouse on hosts,links, or switches to view source and destination ports.
- Zoom in and zoom out using mouse scroll to verify topology for huge topologies.